From Sensor to Sensorium

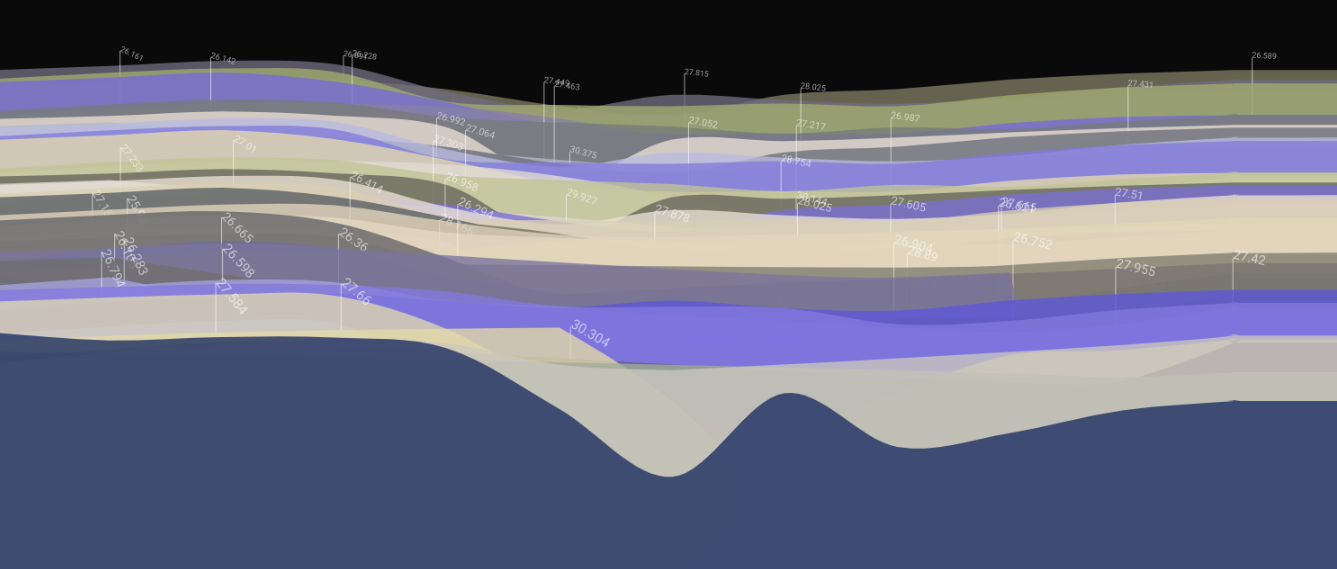
An abstraction of data from a FieldKit station in Peru, monitoring water conditions in the Amazon basin.
Five years ago, I met a neuroscientist who was wearing a strange, vibrating vest. The device, hidden under his clothing, took real-time data from the stock market and sent it to an array of quietly buzzing pads that were in direct contact with his skin. The vest was an experiment in sensory substitution— the idea was that if he wore the vest for long enough, his brain would accept the stock market stimulus as sensory data and he’d begin to actually hear, or to see the data. He would, in effect, gain a new sense.
It’s a really cool idea. Scott Novich and his then advisor David Eagleman have gone on to start a new company marketing the vest and other similar technologies to people with hearing and vision loss, and to budding cyborgs. I’m writing about it here because it’s a good reminder that our own experience of the world isn’t so much about the sensors— our eyes and ears and taste buds —as it is about the sensorium, the whole brain and body system that gives us the ability understand the things that are around us.
Much of the focus of environmental sensing has been on gathering data. We deploy our humidity sensors and anemometers and geophones to turn real world conditions into numbers, which we dutifully write to SD cards and hard drives and file into sqlite databases. Less attention has been paid to what happens next. How do we recognize important patterns in the data? How do we share these findings with others, and how do we make impactful visual narratives to tell data stories to the wider public?

We’ve spent much of the year at FieldKit designing interfaces and workflows that let users easily visualize their data, without having to write code or learn complicated tools. Core to our data platform is the capability to make comparisons, between data from separate sensors or from different time periods, and then to share these comparisons with other. A user in North Carolina might notice that water levels in the Tuckasegee are rising faster than they did for the same period in the previous year; by sharing this finding with collaborators and comparing their data to information from other FieldKit stations along the river, they are able to put their discovery into context. FieldKit also makes downloading and sharing data easy, so people can perform more detailed analysis, post their findings to social media, share the data with a governmental monitoring agency, or use it to make a sculpture, or a performance or a poem.
FieldKit’s mission is to break down the existing barriers around environmental sensing. This means lowering the cost of sensors, but it also means empowering a wide range of individuals and communities (not just the usual suspects) to be able to discover and tell the stories that are encoded in the data they collect. It means that we’re not only making sensors, but also designing an entire sensorium which writes people into the full process of collection, analysis, and telling of environmental data.